


Debugging is an integral part of software development. It helps find and fix errors to enable a high-performing and seamless browsing experience. And since Javascript is the most popular programming language, it is essential to know the top javascript debugging tools to develop an error-free application.
These tools help to ensure that the code works as intended, thus enabling a satisfactory and enhanced user experience.
What Are the Top Javascript Debugging Tools?
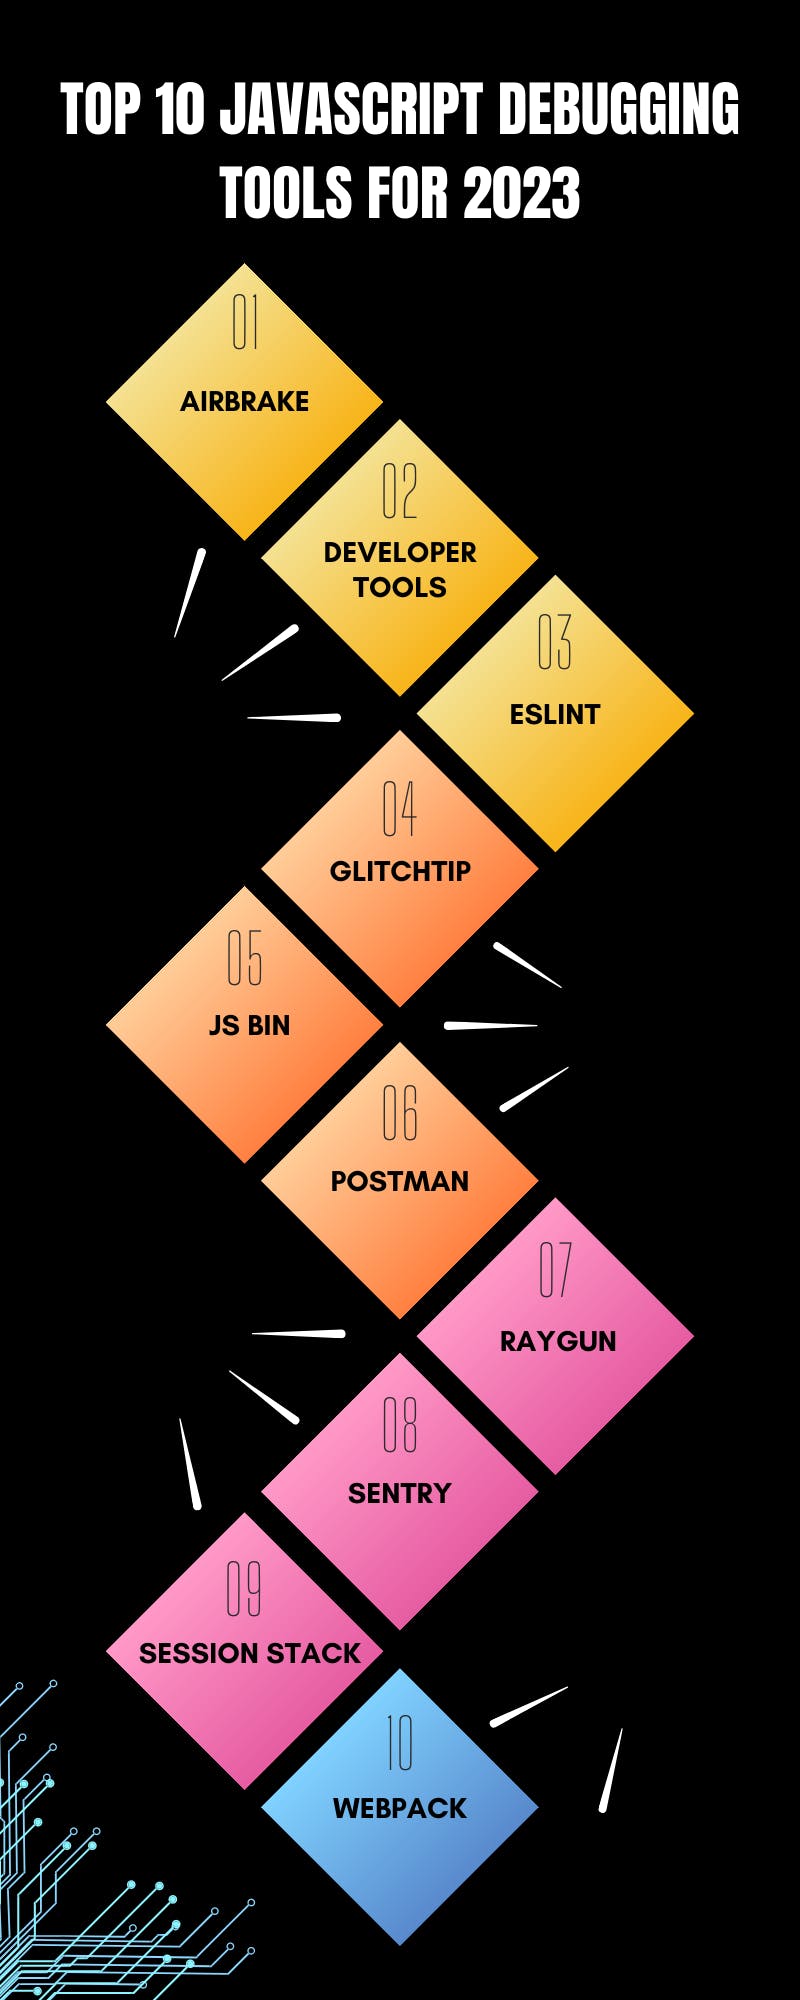
The top javascript debugging tools are -
Airbrake
Developer tools
ESLint
GlitchTip
JS Bin
Postman
Raygun
Sentry
SessionStack
Webpack
Airbrake
It is an error tracking and monitoring tool that helps fix issues quickly and faster code deployment. Its lightweight, agentless, and serverless architecture helps in quick error detection and enables developers to deliver a better user experience.
Deployment tracking, CI/CD integration, Performance Monitoring, and Support breadcrumbs plugin are some of the critical features of this tool. In addition, Airbrake also facilitates real-time notifications on critical issues and supports the integration of GitHub, Slack, and Trello.
Developer tools
Every browser has an in-built set of tools that helps debug and monitor the code easily. Among all, the chrome developer tools are the best Javascript debugging tools. They are widely used in the industry and cater to every developer with their debugging needs, like finding and fixing errors in the code.
Additionally, there are firefox developer tools, safari development menu, opera chromium dev tools, and edge developer tools, which you can find on the respective browsers.
ESLint
One of the most used open-source javascript linting and debugging tools. It is a static code analysis tool that helps find and fix bugs in the Javascript code. ESLint is customizable, where the developer can configure his own rules, has syntax-aware fixes, and supports code preprocessing. In addition, this tool performs a thorough code analysis and is flexible, free, and easy to use.
GlitchTip
It is an open-source tool that helps track bugs in real-time. It has a vast community of developers, a wide user base, and different pricing plans. It also helps in performance monitoring and categorizes the transactions to see which is time-consuming. Self-hosting options, integration with Sentry SDK, and bug aggregation are some of the features of GlitchTip.
JS Bin
Another Javascript debugging tool helps developers test and debug code with others in a collaborative environment. It helps the developers to view the real-time changes and also facilitates them to add as many libraries and dependencies, wherever needed.
In addition, JS Bin is known for its simplicity, remote rendering capabilities, and GitHub exporting tools, and it also supports SSL embeds. It also allows the developers to use custom templates and change their preferences anytime, as needed.
Postman
It is one of the best Javascript debugging tools that help developers debug and troubleshoot code errors. It is compatible with Mac, Windows, and Linux and works great while performing repetitive testing tasks. It also supports integrations, facilitates advanced code analysis, and comes with an integral feature called “connections,” which helps developers save sets of requests and responses of their APIs.
Raygun
It is a cloud-based error monitoring tool that helps developers to get instant visibility of the health of an application. It helps to monitor the Javascript errors that affect the performance of an application. In addition, Raygun helps in crash reporting, real user monitoring, and ap performance monitoring. Besides this, other important features include real-time insights into code, support integration, easy-to-use, and help quickly identify and fix errors.
Sentry
It is an error monitoring tool that helps identify, examine, and respond to bugs and crashes in real-time. It provides visibility to Javascript code and facilitates the developers to detect the location of the bug and deliver quick resolutions. In addition, Sentry helps to track the overall performance and provides insights from different teams. The other features include fault aggregation workflows, which help spot unusual readouts and allow developers to discover the root cause faster.
SessionStack
It is a monitoring software that caters to tools that help collect client-side data. It helps assist and determine the client’s behavior on your software. It helps boost the conversion rate and improves the organization’s performance, alongside being able to track precisely in cases where problems occur.
In addition, SessionStack also facilitates a video replay feature, which helps the developers replicate the errors with ease.
Webpack
It is a bundling tool that is widely used by developers. It helps in bundling and facilitates the stats data about the modules, logs and errors, and others. Another advantage of Webpack is its pre-built tools, like Webpack Analyse Web App, which helps visualize the generated stats.
Wrapping It Up
Numerous javascript debugging tools are available in the market to meet all development needs. Be it a browser-based or a standalone tool, like ESLint, JS Bin, or Chrome Developer tools, developers widely use these tools.
These tools help identify and fix errors in the Javascript code quickly and efficiently. Besides improving the software performance and user experience, these tools also help developers to improve productivity and deliver better results.
FAQs
What are the most used Javascript frameworks?
ReactJS, Vue, Node, Angular, Next, and Nest are popular Javascript frameworks.
Which is the most commonly used tool for javascript debugging?
Airbrake, Chrome Developer tools, Edge Developer Tools, ESLint, GlitchTip, JS Bin, Sentry, and SessionStack are some most commonly used tools for javascript debugging.
What are the steps to debugging a code?
The primary steps indulged in debugging a code are -
Isolate the origin of the bug
Identify the cause of the bug
Determine how to fix the bug and then
Apply and test.